
We create a line plot to visualize the frame intensities over the frame indices. This helps us understand the variations in intensity across frames:
# Frame Visualization
plt.figure(figsize=(10, 6))
plt.title(“Frame Visualization”)
plt.xlabel(“Frame Index”)
plt.ylabel(“Intensity”)
plt.plot(frame_indices, frame_intensities)
plt.show()
We get the following result:
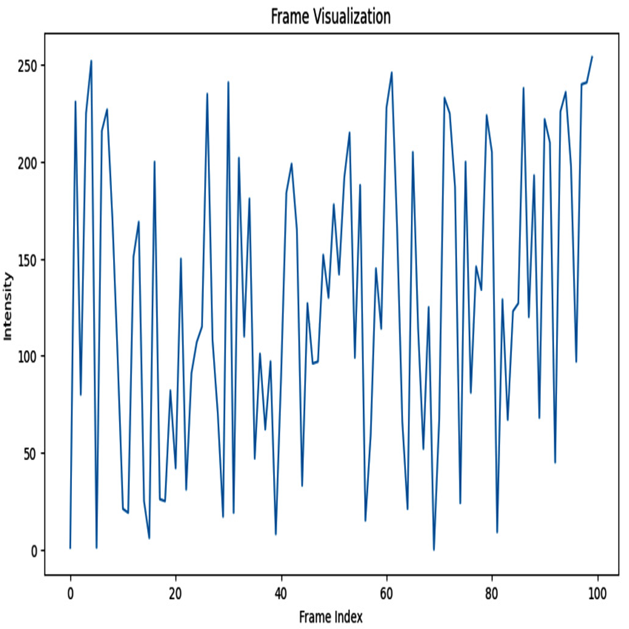
Figure 8.2 – Frame visualization plot
Temporal visualization
Here, we plot the frame intensities against the timestamps. This allows us to observe how the intensity changes over time, providing insights into temporal patterns:
# Temporal Visualization
timestamps = np.linspace(0, 10, 100)
plt.figure(figsize=(10, 6))
plt.title(“Temporal Visualization”)
plt.xlabel(“Time (s)”)
plt.ylabel(“Intensity”)
plt.plot(timestamps, frame_intensities)
plt.show()
We get the following graph:
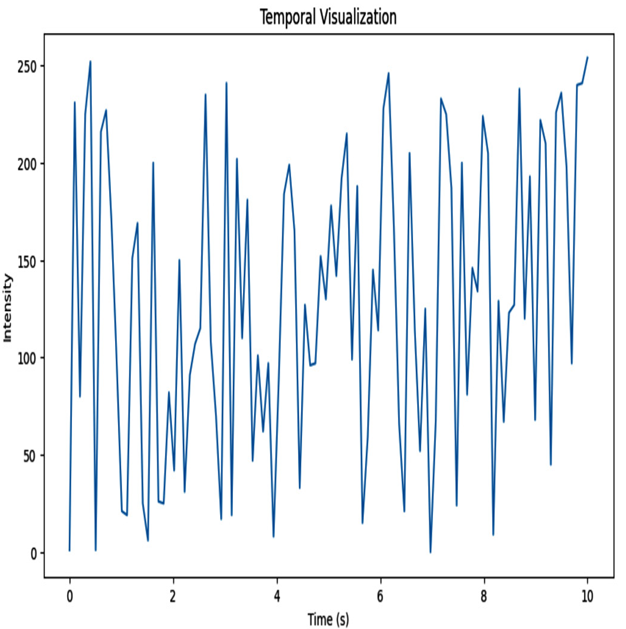
Figure 8.3 – Temporal visualization plot
Motion visualization
To visualize motion, we generate random displacement values dx and dy representing the motion in the x and y directions, respectively. Using the quiver function, we plot arrows at each frame index, indicating the motion direction and magnitude:
# Motion Visualization
dx = np.random.randn(100)
dy = np.random.randn(100)
plt.figure(figsize=(6, 6))
plt.title(“Motion Visualization”)
plt.quiver(frame_indices, frame_indices, dx, dy)
plt.xlabel(“X”)
plt.ylabel(“Y”)
plt.show()
We get the following result:
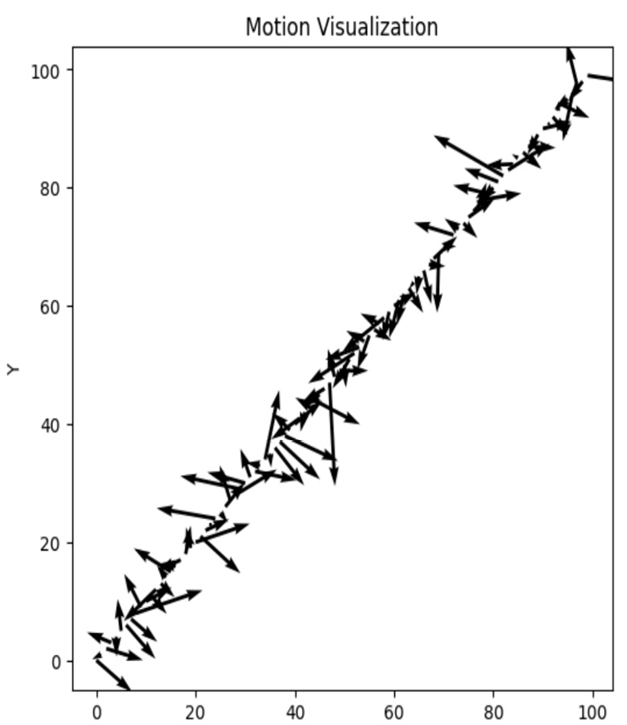
Figure 8.4 – Motion visualization plot
By utilizing these visualizations, we can gain a better understanding of video data, explore temporal patterns, and analyze motion characteristics.
It’s important to note that these are just a few examples of the visualizations you can create when exploring video data. Depending on the specific characteristics and goals of your dataset, you can employ a wide range of visualization techniques to gain deeper insights into the data.
Labeling video data using k-means clustering
Data labeling is an essential step in machine learning, and it involves assigning class labels or categories to data points in a dataset. For video data, labeling can be a challenging task, as it involves analyzing a large number of frames and identifying the objects or events depicted in each frame.
One way to automate the labeling process is to use unsupervised learning techniques such as clustering. k-means clustering is a popular method for clustering data based on its similarity. In the case of video data, we can use k-means clustering to group frames that contain similar objects or events together and assign a label to each cluster.
Overview of data labeling using k-means clustering
Here is a step-by-step guide on how to perform data labeling for video data using k-means clustering:
- Load the video data and extract features from each frame. The features could be color histograms, edge histograms, or optical flow features, depending on the type of video data.
- Apply k-means clustering to the features to group similar frames together. The number of clusters k can be set based on domain knowledge or by using the elbow method to determine the optimal number of clusters.
- Assign a label to each cluster based on the objects or events depicted in the frames. This can be done manually by analyzing the frames in each cluster or using an automated approach such as object detection or scene recognition.
- Apply the assigned labels to the frames in each cluster. This can be done by either adding a new column to the dataset containing the cluster labels or by creating a mapping between the cluster labels and the frame indices.
- Train a machine learning model on the labeled data. The labeled video data can be used to train a model for various tasks such as action recognition, event detection, or video summarization.
